



Solar PV & battery storage
Your roof.
Your options.
Your solar electricity.
Your own roof, a shared roof or a balcony: explore your options and prepare the next questions about available space, electricity use and quotes.
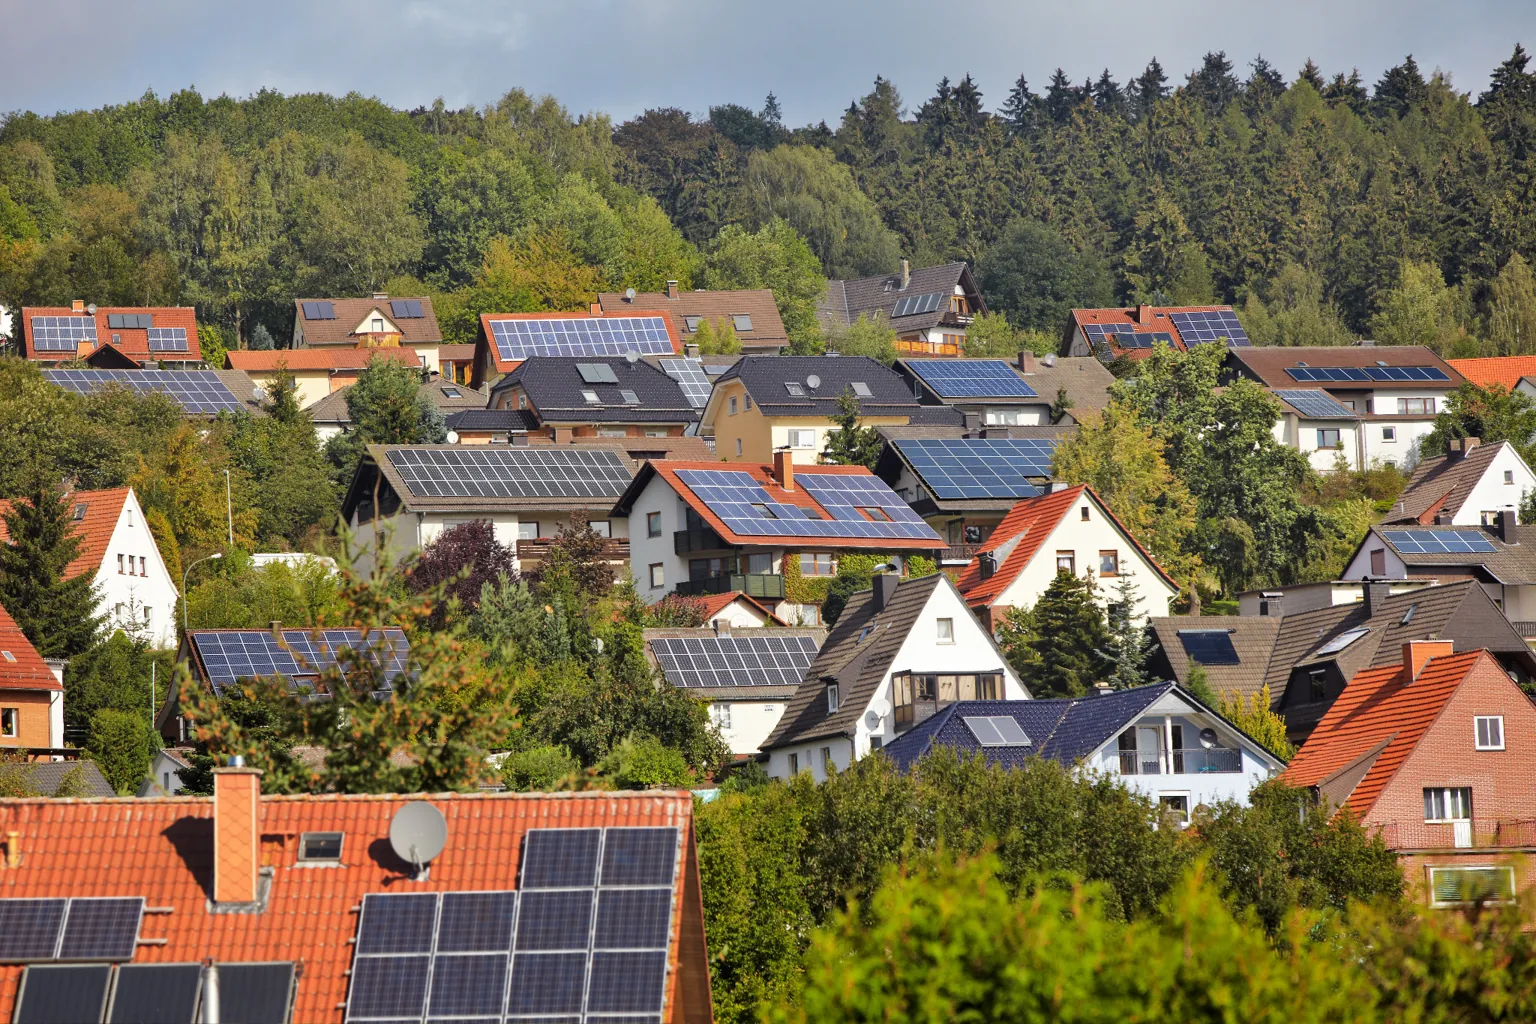
Which situation applies to you?
Your own roof
A PV system for your home
Plan your roof, electricity use and other energy projects together.
A shared roof
Solar electricity for several homes
Tenants, owners’ associations and landlords: agree on the model and responsibilities together.
Flat & balcony
Solar electricity from your balcony
Check the location, agreements and connection for a plug-in solar unit.
Already using solar
Adding battery storage
Compare a battery’s additional benefits, losses and costs.
Ulm city area
Solar PV in Ulm: registered installations
140.8 MWp
Registered PV capacity
Total gross rated capacity of PV systems in operation.
7,830
PV systems in operation
Registered units within Ulm. One unit does not necessarily correspond to one roof or household.
Data as of 29 October 2026, 00:00. Source: Federal Network Agency’s Core Energy Market Data Register.
What do these figures mean?
- Geographical scope: the municipality of Ulm. Neu-Ulm and the Alb-Donau district are excluded.
- Selection: energy source “Solare Strahlungsenergie” (solar radiation), operating status “In Betrieb” (in operation). The total includes all registered PV systems matching these criteria, across different installation types.
- Capacity: the register shows 140,753 kW of gross rated capacity, equivalent to 140.8 MWp after conversion and rounding. This rated capacity does not indicate how many kilowatt-hours the systems actually generate.
- Count: the PV system count refers to 7,830 registered PV units. Extensions or separate units may belong to the same installation or location.
- Reporting status: new installations may not yet appear. Late registrations, corrections and changes in operating status affect the figures. They are a snapshot of the register.
The growth of solar PV across the city does not tell you whether your own roof is suitable. Check your location in the solar map and have the specific design assessed by a professional.
From your roof to your own worked example
The solar roof map gives an initial assessment of buildings in Baden-Württemberg. Its integrated calculator lets you explore your electricity use and possible system options. For Neu-Ulm, you need a service covering Bavaria.
1 · Find your own roof on the map
- Open the map: open the LUBW solar roof map. Read and, if prompted, accept “Hinweise zur Kartennutzung” (map usage notes). The active map should be “Potenzial Dach-Photovoltaik” (rooftop PV potential); use “Karte wählen” (choose map) to select other topics.
- Go to the right building: open “Ortssuche” (place search), enter the address and press Enter. If the search finds nothing, move the map and zoom in with + until you reach your roof. Check the surroundings to confirm that it is your building.
- Click the coloured roof: the building information includes suitable roof area, maximum installable capacity and potential annual generation. Also note the data date. These potential figures are not a specific system design.
- Start the calculator: select “Wirtschaftlichkeitsrechner” (financial calculator) in the same building information panel. It opens in a new tab. Use “Weiter” (next) to work through the inputs and check the preset assumptions.
Have ready: your latest electricity bill, current unit price, typical electricity-use and charging times and, if available, an itemised PV quote.
2 · Fill in the financial calculator with your own figures
Step 1: household, grid export and electricity price
Select the relevant household and check the number of residents, building use and annual electricity consumption in kWh. Use your bill; the suggested figures are not measurements of your home.
To model using your own solar electricity, select “Überschusseinspeisung” (surplus export). “Volleinspeisung” (full export) models a different arrangement. Leave “Solarthermie” (solar thermal) set to “Nein” (no) if you are only assessing electricity generation here.
Under “Strompreis (brutto)” (gross electricity price), enter the unit price in ct/kWh, not your monthly payment. The cog beside it opens the assumed electricity-price increase. Its unit is cents per year, not per cent. Also calculate a case with no increase; the assumption is not a forecast.
Step 2: consumption times, electric car and heat pump
Check the weekday and weekend profiles: when do you actually need electricity? The overlap with PV generation affects how much solar electricity you can use directly.
Add an electric car, heat pump or e-bike only to the extent that its consumption is not already included in the household figure entered. The calculator adds these extra loads on top. Avoid counting the same energy twice.
For an electric car, check mileage, consumption and “Ladeanteil im eigenen Gebäude” (share charged at home). Then adjust charging times to when the car is actually parked at home. A car used during the day should not be given a midday charging window simply because the sun is shining.
Step 3: roof layout, battery storage and costs
Compare the displayed roof sections and module layout with the actual roof, including roof windows, structures and any new shading. Record discrepancies for the installer. The automatic layout is a model suggestion.
Under “Wie soll Ihr Dach belegt werden?” (how should your roof be covered?), choose between financial return, self-sufficiency and filling all suitable areas. These goals can lead to different systems. Note the displayed capacity in kWp.
Start by deliberately selecting “Kein Speichersystem” (no battery storage) or a battery. Also check financing and the age of the meter cabinet. For a focused battery comparison, then use the same PV capacity and consumption assumptions in both cases.
The cog beside “Konfigurierte Photovoltaikanlage” (configured PV system) opens “Preise konfigurieren” (configure prices). This lists PV including installation, battery storage, meter cabinet and scaffolding. Check the units: PV, meter cabinet and scaffolding in €/kWp; battery storage in €/kWh. Check which items your quote already includes and avoid counting costs twice. The calculator shows system costs excluding tax; compare quotes on the same price basis.
Step 4: read and record the results
First check capacity, annual generation, battery storage and costs under “Ihre Photovoltaikanlage” (your PV system), as well as the assumed consumption. A coherent result starts with suitable inputs.
Self-consumption describes the share of solar electricity used by you. Self-sufficiency describes the share of your consumption supplied by solar electricity. Greater self-sufficiency does not automatically mean the best financial return.
Then compare payback time, return and the reported result over 20 years. The table includes EEG revenue, savings from self-consumption, financing and account balance. Also read the stated operating costs and the notes below the result.
Use “Ergebnisse drucken” (print results) to save the results. Record the date and your assumptions too. Use “Zurück” (back) to calculate a second option, and keep separate records of both.
3 · Compare two options fairly
A practical starting point: calculate the same PV system once without and once with a battery. Keep consumption, electricity price and financing unchanged. Check the kWp value after every change: the automatic layout may also change the system size. In that case, you are comparing two system concepts rather than just the additional battery.
A further calculation with a lower electricity-price increase shows how strongly the result depends on that assumption. Take the options and outstanding questions to your discussion with the installer; the calculation offers guidance and replaces neither a roof assessment nor a specific quote.
My roof is missing or shown incorrectly. What now?
Building and height data may predate your home or alterations. A missing entry is therefore not a judgement on suitability. Compare the roof shape, usable area, structures and shading with the actual building.
Background: LUBW solar roof map and data sources and calculation method. The map steps from roof selection and the calculator interface through to the results page were checked on 6 October 2026.
Explore planning for your own home.
How suitable is the roof, what should a complete quote include, and who handles registration and handover? The guide takes you through these decisions.
Is your system around 20 years old?
Review the end of support, continued operation and self-consumption together. Read the post-support decision guide →
Two terms, two perspectives.
Self-consumption rate: how much of my solar electricity do I use myself? Self-sufficiency rate: how much of my electricity demand do I cover with my own generation? In each case, the denominator matters.
One energy balance, two perspectives
Freely chosen annual example without a battery: the same amount of self-consumed electricity gives different percentages.

Example balance and calculations as a table
| Quantity | Value or calculation |
|---|---|
| PV generation | 6,000 kWh |
| Household electricity consumption | 4,000 kWh |
| PV used directly on site | 2,000 kWh |
| PV exported to the grid | 6,000 ? 2,000 = 4,000 kWh |
| Grid import | 4,000 ? 2,000 = 2,000 kWh |
| Self-consumption rate | 2,000 kWh / 6,000 kWh × 100% ? 33% |
| Self-sufficiency rate | 2,000 kWh / 4,000 kWh × 100% = 50% |
What you can gather now.
- Electricity bills showing annual consumption.
- Photos and available roof documents.
- Planned work on the roof or building.
- Typical times of electricity use.
- Other plans, such as an electric car, battery or heat pump.
- Your questions about costs, operation and responsibilities.
Take your questions to an adviser
Use your documents and outstanding questions as the starting point for advice. This helps you consider your roof, electricity use and other plans together.
More than one project.
Allow for future electrical loads when planning. The right combination depends on the building and everyday routines.
How would you like to continue?
Understand the Solarspitzengesetz and smart-meter requirements →
Sources and further information
Editorial status: 16 September 2026. Check funding conditions and connection requirements for your specific project with the responsible organisation.