



Electric mobility · Ulm & region
An electric car.
Plenty of questions.
A good place to start.
Where can I charge, how will my daily routine change, and what will it cost? Start with your own situation.
01 · Getting started
Where are you starting from?
Everyday life
I am thinking of buying an electric car.
Driving patterns, charging times and occasional trips: what matters in your daily life?
At home
I would like to charge at home.
From your own parking space to a shared underground car park: prepare for a home charger.
On the move
I do not have my own parking space.
What charging options are available at work, near home and along your usual routes?
Do you rent or own a flat in a homeowners’ association (WEG)? Start with the guide to your parking situation.
Check energy needs and charging time with your own figures →
Let your daily routine guide you.
Your journeys
Which routes do you usually drive? Include longer trips that matter to you.
Your parking times
Where is the car parked for longer periods? Look for charging options where it would be parked anyway.
Your circumstances
Consider access, tariffs and the charging power supported by both the car and the charge point.
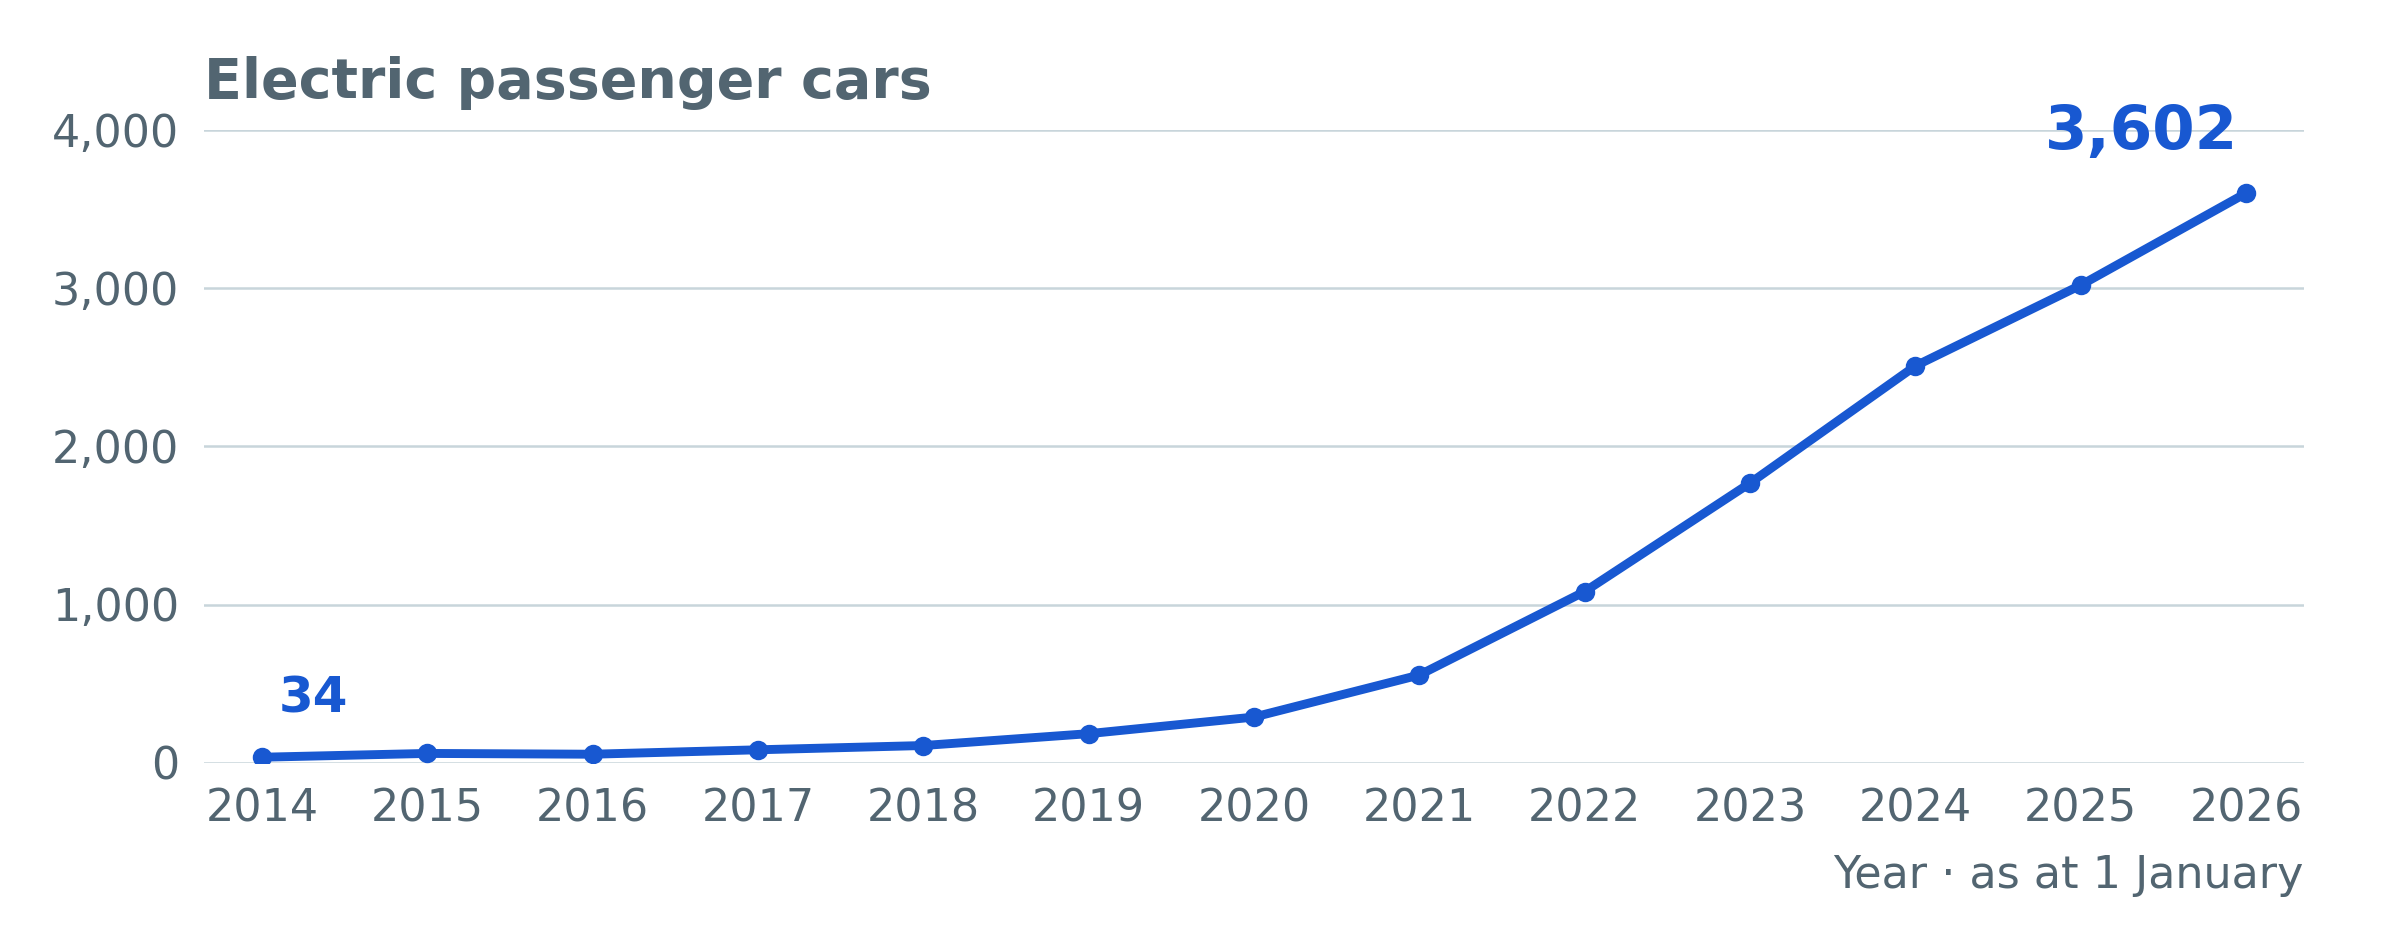
Electric cars in Ulm over time
From 34 electric cars in 2014 to 3,602 in 2026: KBA’s annual vehicle counts show how electric mobility has developed in Ulm’s city district. Every observation refers to 1 January.
Annual values, sources and scope
| Year | Electric cars |
|---|---|
| 2014 | 34 |
| 2015 | 58 |
| 2016 | 53 |
| 2017 | 81 |
| 2018 | 108 |
| 2019 | 183 |
| 2020 | 288 |
| 2021 | 554 |
| 2022 | 1,082 |
| 2023 | 1,768 |
| 2024 | 2,509 |
| 2025 | 3,020 |
| 2026 | 3,602 |
Source: Kraftfahrt-Bundesamt (KBA), FZ 1, registration district Ulm, Stadt (08421). Each linked year opens its original source table. These are registered vehicles, not new registrations; plug-in hybrids are excluded. KBA labels the category “Pkw mit Elektromotor” until 2016, “Elektro” from 2017 and “Elektro (BEV)” from 2021.
All 13 annual observations are documented. The decline in 2016 is retained; no values have been added before 2014. Checked on 30 October 2026.
02 · Understanding costs
What affects
your charging costs?
The calculation depends on annual mileage, actual electricity use and your charging prices. This example shows how the charging location affects costs:
- 12,000 km per year and 20 kWh per 100 km, including charging losses, require 2,400 kWh of charging electricity.
- At €0.32/kWh at home, this costs €768 per year.
- At €0.55/kWh at public chargers, this costs €1,320 per year.
- Charging 70% of the energy at home and 30% at public chargers costs around €934 per year.
These are illustrative assumptions, not current tariff offers. Purchase, installation, maintenance and fixed fees are excluded. Use your own mileage and tariffs for your calculation.
Compare two charging scenarios using your own mileage and electricity prices. For fixed, session and time-based fees at public chargers, use the more detailed tariff comparison.
What is the total cost of owning the car?
A purchase decision also involves the purchase price, resale value, financing and other running costs. The total vehicle cost calculator compares two options over the same period.
Check funding before deciding: EV funding: eligibility and application steps · Official programme information from Germany’s environment ministry →. Check the conditions for your project. If funding has not yet been approved, also calculate a scenario without it.
Car + solar PV
Let your roof help charge your car.
If your car is at home when solar power is generated, the two projects can complement each other. Timing and suitable controls are key.
What is an electric car’s environmental impact?
Both production and use contribute to the climate footprint. The study comparison below indicates the scale for comparable new cars. Your actual footprint depends on factors such as vehicle size, electricity supply and service life.
How do production and use contribute to a car’s climate footprint?
Study comparison of new medium-sized cars in the EU, 2025: the same lifetime mileage of 240,000 km. EV battery production is included in the production segment. The electricity mix changes over the vehicle’s lifetime in the study scenario.

What the comparison shows: The EV’s higher production emissions are offset by much lower emissions during use. In this study scenario, the total is 63 instead of 235 g CO₂e/km - around 73% less.
For your decision: Compare similarly sized cars serving the same purpose. Electricity supply, consumption, battery size and service life affect the result. The chart does not tell you when replacing your existing car would benefit the climate.
Vehicle data and study assumptions
ICCT, July 2025: 20 years, 240,000 km; EV with a 53.4 kWh battery. Assumed real-world consumption: 20.2 kWh/100 km including charging, or 6.9 l/100 km. Petrol includes the study’s assumed biofuel share. Vehicle characteristics are based on 2023 EU sales. The future electricity mix is a projection, not an observed trend.
| Life-cycle stage | Petrol car | Electric car |
|---|---|---|
| Production incl. recycling | 30.0 | 43.3 |
| Use incl. energy and maintenance | 205.0 | 19.7 |
| Total | 235 | 63 |
Our grouping of rounded source values: production including recycling amounts to 7.2 t for the petrol car and 6.5 + 3.9 t for the EV, divided by 240,000 km. Use is the difference from the study’s total and includes energy supply, driving and maintenance. Based on Table 1, the battery section and Figure ES1. Only climate impact is compared.
Source, checked on 30 September 2026: ICCT: life-cycle comparison of passenger cars in the EU (2025).
Why do size and service life matter?
Compare vehicles that serve the same purpose. The IEA life-cycle calculator lets you vary vehicle size, battery size, annual mileage, lifetime and electricity mix. This illustrates why a single percentage cannot apply to every individual car. IEA: compare assumptions yourself.
Your journeys also matter: public transport, cycling, walking or shared vehicles may be alternatives, depending on your routine. Electric cars alone do not solve traffic or parking problems. European Environment Agency: mobility in context.
Sources checked on 22 September 2026. The linked studies use their own stated vehicles, reference years and assumptions.
Questions and common assumptions.
“An electric car needs a home charger.” Is that true?
A home charger is one option. What matters is reliable charging that fits your routes and parking times. Explore charging without your own parking space →
Will the advertised range match my everyday range?
Actual range depends on factors including the vehicle, speed, temperature and use. Compare your journeys with information about the specific car. Prepare for everyday EV use →
Do I need the highest possible charging power at home?
Consider the vehicle, energy needs and available parking time together. A qualified installer can assess the right technical solution. Prepare for my home charger →
Can this website assess my grid connection?
The platform helps you prepare. A qualified installer and the responsible grid operator handle the technical assessment and connection approval.
What would you like to do next?
Sources and further information
Editorial information as of 16 September 2026. Check funding conditions and connection requirements for your specific project with the responsible organisation.